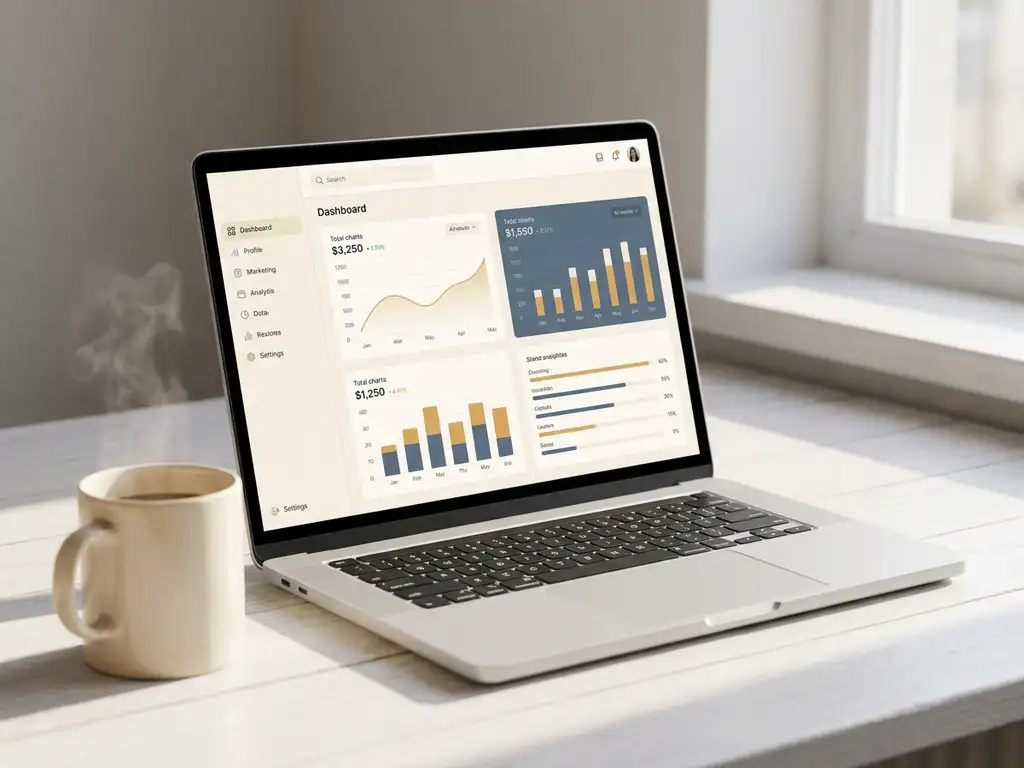
Creating HR reports without programming knowledge is entirely possible with the right no-code HR tool. Modern platforms automatically convert employee data into clear dashboards and reports, giving HR professionals and managers direct insight without needing an IT department. In this article, we answer the most frequently asked questions about HR reports, dashboards, and how to choose the right solution for your organization.
Which features make HR reports accessible to non-technical users?
HR reports are accessible to non-technical users when a tool offers drag-and-drop report builders, pre-configured templates, and automatic data visualization. Users don't need to write code or know formulas: the software translates raw HR data directly into readable charts, tables, and summaries.
The features that make the biggest difference are:
- Templates and standard reports that you can use immediately without building anything
- Drag-and-drop editors that let you customize reports without technical knowledge
- Automatic data processing that combines survey results, engagement scores, and feedback data
- Role-based access so a team leader only sees their own team's data
- Export functions to PDF or PowerPoint for management presentations
Those last two features in particular are often underestimated. An HR director needs a complete overview; a manager only wants to know how their team is performing and what they can do differently tomorrow. A good no-code HR tool handles both views from the same system, without anyone needing to configure anything.
What is the difference between an HR dashboard and an HR report?
An HR dashboard is a live overview of current HR data — such as engagement scores, absenteeism figures, or eNPS — that is continuously updated. An HR report is a static document that summarizes a period and is intended for analysis, sharing, or archiving. Both are useful, but for different purposes.
Use an HR dashboard when you want to quickly see how things stand right now. It's ideal for weekly check-ins, for managers who want to monitor their team, or for HR Business Partners who want to pick up on signals early. The dashboard answers the question: what's happening right now?
Use an HR report when you want to close out a period, present results to leadership, or substantiate policy changes. The report answers the question: what has happened over the past months and what does that mean?
In practice, dashboards and reports complement each other. A good platform automatically generates a periodic report based on the same dashboard, so you don't have to do the work twice.
Which HR data can be automatically converted into reports?
Most modern HR reporting tools automatically convert feedback data from employee surveys, engagement scores, eNPS results, and driver analyses into reports. Additionally, data on absenteeism, turnover, and onboarding can be linked when the tool integrates with an HRM system.
Specifically, the following data sources are well-suited for automation:
- Results from employee satisfaction surveys, including open-ended responses and scores by theme
- Engagement and energy measurements, such as the outcomes of pulse surveys
- eNPS scores by team, department, or location
- Driver analyses that indicate which factors most strongly determine the employee experience
- Absenteeism and turnover data when provided via an integration
- Feedback trends over time, so you can see whether improvement actions are having an effect
Automation not only saves time: it also ensures that reports are consistent and don't depend on who compiles them. This is important when comparing multiple teams or locations.
How do you choose the right HR reporting tool for your organization?
Choose the right HR reporting tool based on three criteria: the degree of ease of use for non-technical users, alignment with your measurement methodology, and the ability to move from scores to concrete improvement actions. A tool that only shows numbers without context doesn't help managers move forward.
Ask yourself the following questions when making your choice:
- Can managers independently view their team report, without involvement from HR or IT?
- Does the tool show why a score is high or low, not just that it is high or low?
- Does the tool support continuous employee research rather than just an annual measurement?
- Is the tool GDPR-compliant and does it meet security standards such as ISO 27001?
- Are there options for closed-loop follow-up, so that feedback leads to demonstrable action?
Also pay attention to scalability. A tool that works well for fifty employees may fall short when your organization grows or when you want to segment by department, job group, or location. Choose a solution that scales with you and generates reports at the level that is relevant for each user.
What does an HR report look like that managers actually use?
An HR report that managers actually use is concise, visual, and action-oriented. It answers three questions: how is my team performing, what are the main causes, and what can I concretely do tomorrow? Reports that only show scores without interpretation are opened and closed again immediately.
In practice, managers disengage from reports that are too long, contain too much statistical content, or don't translate into action. What does work:
- A summary page per team with the three or four most relevant scores
- A driver view showing which factors are pushing the score up or down
- A comparison with the previous measurement, so the trend is visible
- Concrete follow-up suggestions linked to the scores
At CTAC, an IT services provider that works with employee feedback, managers only started to see real value in the reports when they no longer ended at a number, but clearly showed which themes had the most impact on their team's workplace happiness. That is the difference between a report that ends up in a drawer and one that leads to a team conversation.
When is a no-code HR reporting solution not sufficient?
A no-code HR reporting solution is not sufficient when you need very complex data models, want to deeply integrate multiple external systems, or when you are building custom applications that require specific business logic. For most HR challenges, however, a no-code tool offers more than enough functionality.
Specific situations where you need to look beyond a standard no-code HR tool:
- You want to link feedback data to financial performance indicators from multiple source systems simultaneously
- Your organization has specific compliance requirements that demand custom fields and tailored data storage
- You want to build predictive models based on historical HR data, which requires statistical expertise
- Reports need to be fully integrated into an existing ERP system with its own data structure
For most HR directors, HR Business Partners, and managers who want to measure and follow up on engagement, vitality, and employee satisfaction, however, a no-code solution is more than sufficient. The value lies not in technical complexity, but in the quality of the questions, the interpretation of the answers, and the follow-up per team.
How CYS Group helps with HR reporting without programming knowledge
CYS Group offers with the platform cx.management a solution that enables HR teams and managers to independently set up, view, and follow up on reports — without technical knowledge or IT support. The approach is based on the Story-Led XM methodology: not stopping at a score, but translating it into what is happening, why, and which action has the most impact.
What this means concretely for your organization:
- Employee feedback is collected via the proprietary 3-question methodology, so you always know what is driving a score
- The driver model maps which factors most strongly determine the employee experience, without statistical expertise
- The Priority Matrix translates drivers directly into priorities for managers
- Closed-loop follow-up ensures that feedback leads to demonstrable action, per team and per moment
- The platform is GDPR-compliant and ISO 27001-certified, so you work securely and compliantly
Want to see what this looks like in practice for your organization? Get in touch and discover how CYS Group helps you move from data to real improvement.
Make every experience count.
Frequently Asked Questions
Hoe lang duurt het om een HR-rapportagetool zoals CYS Group in te richten?
De meeste no-code HR-rapportageplatformen zijn binnen enkele dagen operationeel, zonder langdurige implementatietrajecten of IT-projecten. Je begint doorgaans met een standaardsjabloon dat aansluit op jouw meetmethodiek, waarna je rolgebaseerde toegang instelt voor leidinggevenden en HR-medewerkers. Bij CYS Group ondersteunt een implementatiespecialist dit proces, zodat je snel van start kunt zonder technische kennis.
Hoe zorg ik ervoor dat leidinggevenden de HR-rapportages ook daadwerkelijk openen en gebruiken?
De grootste drempel voor gebruik is een rapport dat te complex is of geen directe vertaalslag maakt naar actie. Zorg voor een beknopte teamweergave met maximaal drie à vier kernscores, een duidelijke trendvergelijking en concrete opvolgingssuggesties. Stuur leidinggevenden een automatische notificatie zodra een nieuwe rapportage beschikbaar is, zodat het raadplegen ervan een vast ritme wordt in plaats van een eenmalige actie.
Wat als mijn organisatie al een HRM-systeem heeft — kan ik dat koppelen aan een HR-rapportagetool?
Ja, de meeste moderne HR-rapportageplatformen bieden integraties met veelgebruikte HRM-systemen zoals AFAS, Visma Raet of SAP SuccessFactors, waardoor gegevens over verzuim, verloop en personeelssamenstelling automatisch worden gesynchroniseerd. Controleer bij de selectie van een tool altijd welke koppelingen standaard beschikbaar zijn en of maatwerkkoppelingen mogelijk zijn als jouw systeem minder gangbaar is. Een goede integratie voorkomt dubbele datainvoer en verhoogt de betrouwbaarheid van je rapportages.
Hoe bescherm ik de privacy van medewerkers bij het gebruik van HR-rapportages?
Een AVG-proof HR-rapportagetool werkt standaard met anonimisering: individuele antwoorden zijn nooit herleidbaar tot een specifieke medewerker, en rapportages worden pas gegenereerd wanneer een minimale responsdrempel is bereikt (doorgaans vijf tot tien respondenten). Controleer of de tool voldoet aan ISO 27001 of vergelijkbare beveiligingsnormen en of de dataopslag plaatsvindt binnen de Europese Unie. Communiceer deze waarborgen ook actief naar medewerkers, want vertrouwen in anonimiteit verhoogt de responsbereidheid aanzienlijk.
Hoe vaak moet ik HR-rapportages genereren om echt inzicht te krijgen in trends?
De frequentie hangt af van je meetmethodiek: bij een jaarlijks medewerkerstevredenheidsonderzoek genereer je één uitgebreide rapportage per cyclus, terwijl pulse-onderzoeken zich lenen voor maandelijkse of kwartaalrapportages waarmee je trends over tijd kunt volgen. Wacht niet tot het einde van het jaar om te rapporteren, want dan mis je vroegtijdige signalen van dalende betrokkenheid of oplopend verzuim. Een combinatie van een live dashboard voor dagelijkse monitoring en een periodiek rapport voor strategische besluitvorming geeft het meeste inzicht.
Welke veelgemaakte fouten moet ik vermijden bij het opzetten van HR-rapportages?
De meest voorkomende fout is rapportages bouwen voor HR, in plaats van voor de leidinggevenden die er dagelijks mee werken: te veel metrics, te weinig context en geen koppeling naar concrete actie. Een tweede veelgemaakte fout is het negeren van open antwoorden en kwalitatieve feedback, terwijl juist die data verklaart waarom een score hoog of laag is. Zorg tot slot dat rapportages niet eenmalig worden gedeeld, maar onderdeel worden van een terugkerend gesprek tussen leidinggevende en team, zodat feedback aantoonbaar leidt tot verbetering.
Kan een no-code HR-rapportagetool ook worden ingezet voor specifieke doelgroepen zoals nieuwe medewerkers of medewerkers die vertrekken?
Ja, moderne no-code platforms ondersteunen doelgroepgerichte rapportages voor specifieke momenten in de medewerkersreis, zoals onboarding-ervaringen, exitonderzoeken of welzijnsmetingen na een reorganisatie. Je segmenteert de data op basis van kenmerken zoals functiegroep, afdeling, locatie of dienstverbandlengte, zonder dat je daarvoor technische aanpassingen hoeft te doen. Dit maakt het mogelijk om gerichte verbeteracties te koppelen aan specifieke fases of groepen, in plaats van te werken met één gemiddeld organisatiecijfer.