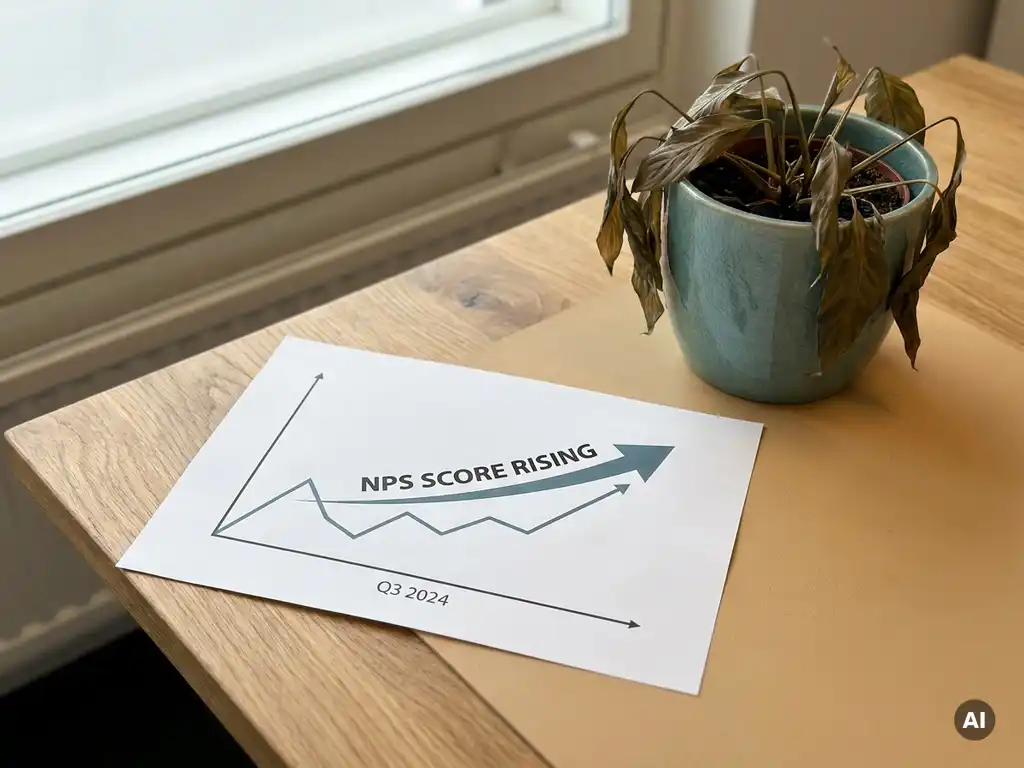
A rising NPS but no noticeable improvement in customer experience? That's because NPS measures how likely customers are to recommend you, but not why they do so or what actually changes in their day-to-day experience. The score sometimes rises due to factors that have nothing to do with genuine service improvement. In this article, we answer the most frequently asked questions about this paradoxical phenomenon and show you when NPS is reliable.
What does NPS actually measure — and what doesn't it measure?
NPS, or Net Promoter Score, measures customers' willingness to recommend your organisation to others. You calculate NPS by subtracting the percentage of detractors (score 0–6) from the percentage of promoters (score 9–10). The result is a number between -100 and +100. What NPS does not measure is the quality of specific experiences, the root cause of dissatisfaction, or which processes need to be improved.
NPS gives you a snapshot of sentiment, not a diagnosis of experience. The question "How likely are you to recommend us?" asks customers to form a judgement based on their overall impression. That overall impression is influenced by dozens of factors: the most recent interaction, price, brand perception, even how the customer feels that day.
What NPS therefore misses:
- Insight into which touchpoints colour the experience positively or negatively
- The underlying drivers that explain loyalty
- Concrete starting points for improvement per team or process
- Information about customers who don't respond to your survey at all
That makes NPS valuable as a signal metric, but insufficient as a steering instrument. Anyone who manages only to the score misses the story behind the number.
How can an NPS score rise without customers noticing any difference?
An NPS score can rise because the composition of your respondents changes — not because the experience improves. If satisfied customers respond more often than dissatisfied ones, or if your measurement moment shifts to a positive touchpoint, the score goes up while nothing has changed operationally.
There are several mechanisms that explain a rising NPS without genuine improvement:
- Response bias: Promoters respond more often than detractors. If your invitation timing or channel changes, the response automatically shifts.
- Measurement timing effect: A survey sent immediately after a positive experience (such as a successful delivery) consistently produces higher scores than a survey sent after a complaint.
- Market effects: If competitors are performing worse, customers become relatively more positive about you — without you having changed anything.
- Forgetting curve: Customers who haven't been in contact for a while remember the positive moments better than the frustrations.
This is precisely why a rising NPS can sometimes create a false sense of security. The score tells you that something has changed, but not what. Without driver analysis, you don't know whether the increase is structural or a measurement artefact.
Discover what customers truly care about and give every team clear priorities to improve the customer experience in a focused way.
Discover CX/KTO →Why doesn't measuring more automatically lead to a better experience?
Measuring more doesn't lead to a better experience because measurement itself generates no action. Organisations that collect a lot of feedback but have no clear process for translating that feedback into concrete improvements accumulate data without results. The customer notices nothing from a dashboard full of scores.
The pitfall is that measuring becomes an end in itself. Teams report the NPS in meetings, compare quarterly figures, and celebrate a rise — but the question "what are we doing differently for the customer?" goes unanswered. Feedback disappears into reports nobody reads.
What makes the difference is a closed loop: from feedback to insight, from insight to action, from action to follow-up with the customer. In practice, this means that a dissatisfied customer doesn't just give a low score — they also send a signal that someone picks up, discusses, and feeds back. That's called closed-loop feedback: you close the loop by letting the customer know their signal was heard and what you did with it.
Only when that loop closes does the customer feel that measuring actually delivers something. And only then does the experience genuinely improve.
What signals show that NPS and customer experience are out of step?
There are concrete signals that indicate your NPS score and the actual customer experience are no longer aligned. The most telling signal is when NPS rises while complaint volume, churn, or contact frequency increase at the same time.
Watch out for these warning signs:
- NPS is rising, but response to your survey is declining structurally
- Employees don't recognise the positive scores in their day-to-day customer interactions
- Customers who gave a high score still switch to a competitor
- Open-ended answers in your survey are more negative than the numerical score suggests
- There is no difference in NPS between customers who experienced a problem and those who didn't
That last point is particularly telling. If customers who filed a complaint give the same NPS as customers with no issues, your instrument is no longer measuring the experience sharply enough. Then it's time to dig deeper: which drivers determine the score, and which touchpoints in the customer journey deserve attention?
What is a better approach to genuinely improving the experience?
A better approach starts with understanding the drivers behind the score. Instead of only asking "how likely are you to recommend us?", you also ask what determines that rating and what the customer would like to see done differently. That way you move from a number to a story you can actually use.
Concrete steps that make the difference:
- Add a driver question: Let customers indicate which aspects influenced their score the most. This makes prioritisation possible without complex statistics.
- Measure at the right moment: Transactional research immediately after a touchpoint delivers more relevant feedback than an annual survey. This links the score to a concrete experience.
- Build a Priority Matrix: Map out which drivers have the greatest impact on satisfaction and score the lowest. Those are your improvement areas with the highest urgency.
- Close the loop: Ensure that dissatisfied customers are called back or contacted within an agreed timeframe. Let them know what you did with their feedback.
- Make insights accessible to teams: Feedback shouldn't land only with the CX manager. Team leaders who see their own scores can course-correct immediately.
The core is simple: a score tells you that something is going on. A story tells you what, why, and what you need to do. Those who take that step find that measuring and improving go hand in hand.
When is NPS a reliable indicator of customer experience?
NPS is a reliable indicator of customer experience when you measure it consistently, at the right moment, among a representative group of respondents, and combine it with qualitative questions about the drivers behind the score. In that case, NPS is a powerful signal that makes trends in experience visible over time.
Specifically, NPS works well when:
- You compare the score over a longer period, not quarter by quarter
- You monitor responses for representativeness (not only satisfied customers fill it in)
- You combine NPS with other metrics such as CSAT or CES at specific touchpoints
- You structurally analyse the open-ended comments, not just the numerical score
- You break the score down by customer segment, region, or team to identify patterns
Calculating NPS is only the beginning. The value lies in what you do with it: using the score as a compass, not as a final destination. Organisations that embed NPS within a broader feedback programme with driver analysis and closed-loop follow-up find that the score and the experience do keep pace with each other.
How CYS Group helps you move from NPS score to genuine improvement
CYS Group helps organisations bridge the gap between a rising NPS and a stagnant customer experience. Not by measuring more, but by measuring smarter and taking the step towards action.
Concretely, we do this with:
- The 3-question methodology: a compact approach that, alongside the NPS question, also maps the drivers and the action the customer wants — without lengthy questionnaires
- The driver model: clear insight into which factors most determine the experience, without heavy statistics, directly usable by teams
- The Priority Matrix: a clear visualisation of what is most urgent to improve, based on impact and current score
- Closed-loop case management: dissatisfied customers are automatically flagged and followed up, so the loop truly closes
- The platform cx.management: dashboards that steer teams on customer experience — not just reports that end up in a drawer
Want to know how your organisation can make the move from scores to stories that lead to genuine improvement? Get in touch with CYS Group and discover what's possible for your customer programme.
Make every experience count.
Frequently Asked Questions
How often should I measure NPS to see reliable trends?
The measurement frequency depends on your customer volume and touchpoints. For transactional research: measure immediately after every relevant touchpoint, such as a purchase, delivery, or customer service conversation. For relational research, a bi-annual or annual measurement is generally sufficient, provided you always use the same method and the same measurement moment. Consistency is more important than frequency: a score measured at the same moment every time is more comparable than a score collected at a different moment each quarter.
What is a good NPS score and how do I know if my score is 'good enough'?
An NPS score is only meaningful in context. A score of +30 may be excellent in the telecoms sector but below par in the software industry. Always compare your score with industry peers via benchmarks én with your own historical scores over time. More importantly: don't just look at the absolute number, but at the direction of the trend én the underlying drivers. A stable score with clear improvement points is more valuable than a high score with no insight into what drives it.
Which additional metrics combine best with NPS?
The most commonly used combinations are NPS with CSAT (Customer Satisfaction Score) and CES (Customer Effort Score). CSAT measures satisfaction with a specific interaction and is ideal after a customer service conversation or purchase. CES measures how much effort a customer had to put in to reach their goal and is particularly useful for processes such as complaint handling or onboarding. By combining NPS as an overarching loyalty metric with CSAT and CES at specific touchpoints, you get both the big picture and the details you need to improve in a targeted way.
How do I deal with a low response rate on my NPS survey?
A low response rate is a serious signal: it means your results may not be representative of your full customer base. Improve the response rate by keeping your survey short (maximum 3 questions), choosing the right channel (email, SMS, or in-app depending on your customer), and sending the invitation at a logical moment in the customer journey. Also avoid survey fatigue by not approaching customers too frequently. Additionally, analyse who is not responding: if dissatisfied customers in particular are dropping out, you are structurally overestimating your own score.
What do I do if my employees start 'managing' the NPS scores instead of the experience?
This is a common pitfall that arises as soon as NPS scores are linked to performance reviews or bonuses. Employees then start asking customers to give a high score, selectively sending out surveys, or avoiding negative feedback. The result: a rising score that no longer says anything about the actual experience. Prevent this by using NPS as a learning tool, not as a performance evaluation criterion. Link rewards to the follow-up of feedback and the quality of improvement actions rather than to the number itself.
How do I involve internal teams in NPS research outcomes without it remaining a 'CX thing'?
Make customer feedback part of the regular working processes of every team, not just the CX department. Share scores broken down by team, region, or product line so that every team leader sees their own results and feels ownership. Organise short, fixed moments — for example a weekly fifteen minutes — in which teams discuss the most recent feedback and agree on één concrete action. Feedback that is directly recognisable to the people on the work floor has far more impact than a monthly report that arrives via the manager.
When is it time to fundamentally rethink my current NPS approach?
It's time for a thorough review if you are structurally seeing one or more of the following signals: the response rate has been declining for several periods in a row, open-ended answers are consistently more negative than the numerical score, improvement initiatives are producing no visible movement in the score, or employees and customers no longer recognise the results in day-to-day practice. A review doesn't have to mean abandoning NPS, but it does mean critically examining the measurement method, the measurement moment, the question design, and the follow-up process. Sometimes a small adjustment in timing or question wording is enough to significantly improve reliability.